Dashboarding Manual
Find your way in Codman – the dashboarding application
Codman Portal – the landing page
When you log in to the dashboarding application, you will arrive at the Codman portal. On the Codman portal you can see all registries you have access to in one overview.
Click on a registry to go to the registry portal of the chosen registry.
Registry portal – the starting point for the different dashboards
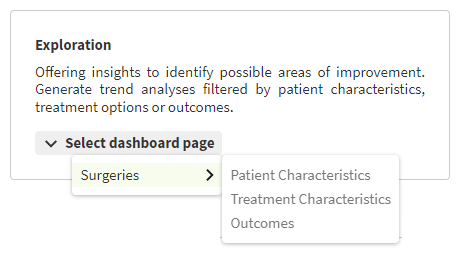
The registry portal serves as a starting point for the various dashboards available for the chosen registry. Click on ‘select dashboard page’ on the Exploration dashboard to see which subsets/pages are available and choose the desired page.
Additionally, you will find the following information on the registry portal:
- Information about the registry: A description of the registry and the managing organization. There’s also the option for you to navigate directly to the associated websites with more information about the registry or the managing organization.
Navigation between pages within the dashboard
You can easily find your way in the application via the navigation menu at the top of the page.

Using this menu you can navigate to every page within the dashboard. The navigation menu has a hierarchical structure. You can switch on every level and follow the dropdown menus to navigate to the desired page at once.
Apply filters
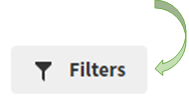
On every page within the Exploration dashboard you can apply filters. The filter menu opens by clicking the Filter button on the top right:
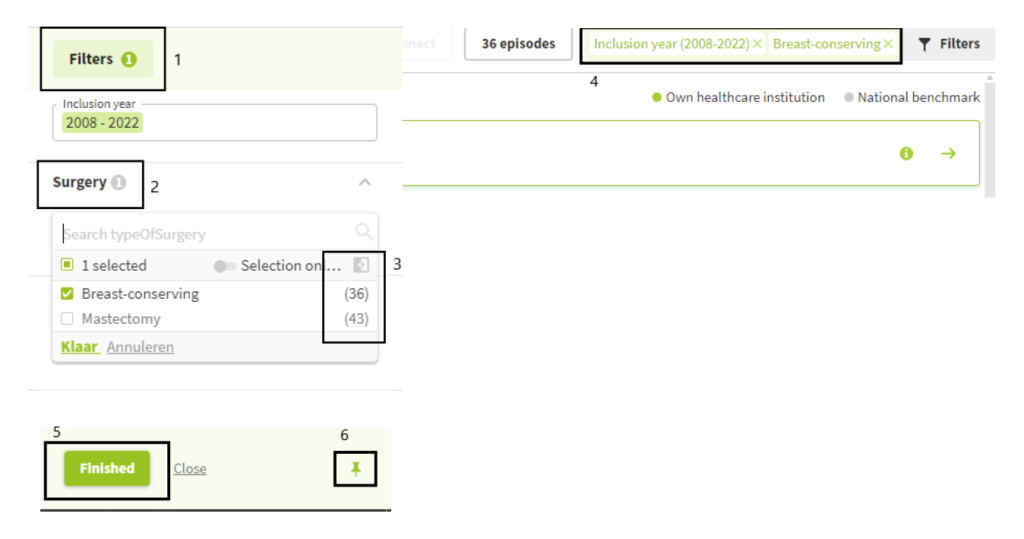
In the menu you can select the desired filters under the different filter categories. Filters are applied to both the data of the own healthcare institution and the benchmark data.
- The total number of selected filters is displayed in the filter button (1) and this is also shown per category (2).
- The numbers behind each filter option indicate how many cases/patients remain in the selection for the own healthcare institution (3).
- To close the filter menu, click the Filter button again. At the top right of the screen you can see how many patients are in the current selection for your own healthcare institution. You can also easily remove a filter here to expand the selection. (4)
- You can also remove all filters all together via the option ‘Clear all and close’ at the bottom of the filter menu (5).
- Finally, you have the option to pin the filter menu to the right side of the screen by clicking on the pin icon (6).
Analyze trends
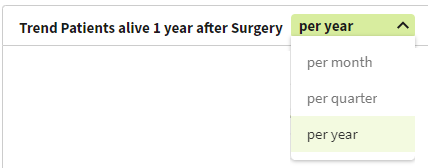
The course of an outcome over time is shown in the trend graph on the detail page. Click on an outcome to navigate to the detail page.
By default, the year-level trend is displayed. You can also choose to change to a quarterly or monthly trend via the dropdown menu in the chart header.
Note: If no data is available for a given measurement moment, the data point is not shown. This can cause interruptions in the trendline.
Exports
PDF export
By clicking on the export icon in the sidebar menu on the left, you can generate a PDF export.

The export is made for the current subset and filter selection. Both the scores (own healthcare institution and benchmark) and trends are exported for all outcomes.
It is currently not yet possible to make a selective export or to export to a format other than PDF.